No items found in your cart!
No items found in your cart!
 you definitely can not afford to miss this. READ HERE https://www.hub.goglowonline.com/view-post.php?post_id=69, Thanks for always taking out time to read through our blog posts @ Goglow Hub! We are Happy that you enjoy it!&image=<img src='https://www.hub.goglowonline.com/upload/17597393371759737322828.jpg'/>) |
|
|
|
|
|
|
|
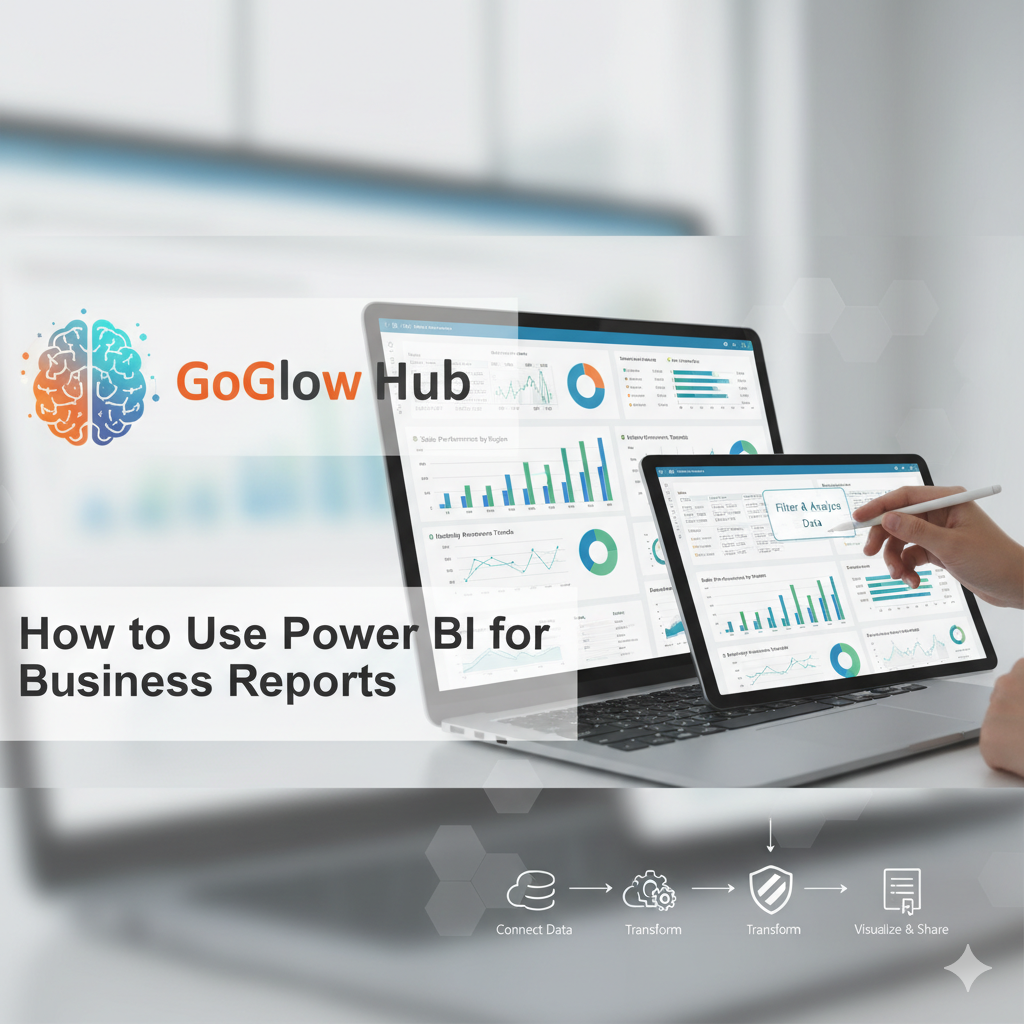
In today’s world, data is one of the most valuable assets any business can have. Whether you run a small shop, a training centre like Goglow Hub, or a growing company, you need to track your numbers — sales, expenses, customers, and performance.That’s where Power BI comes in.
Microsoft Power BI is a powerful business intelligence tool that helps you turn raw data into beautiful, interactive business reports and dashboards. With Power BI, you don’t just see numbers — you understand them.
What is Power BI?
Power BI is a data analysis and visualization tool developed by Microsoft. It helps users connect to different data sources (like Excel, SQL, or Google Sheets), analyze the data, and create interactive dashboards that tell meaningful business stories.
In simple terms, Power BI helps you make better business decisions through visuals.
Here are some reasons why Power BI is great for businesses in Nigeria and beyond:
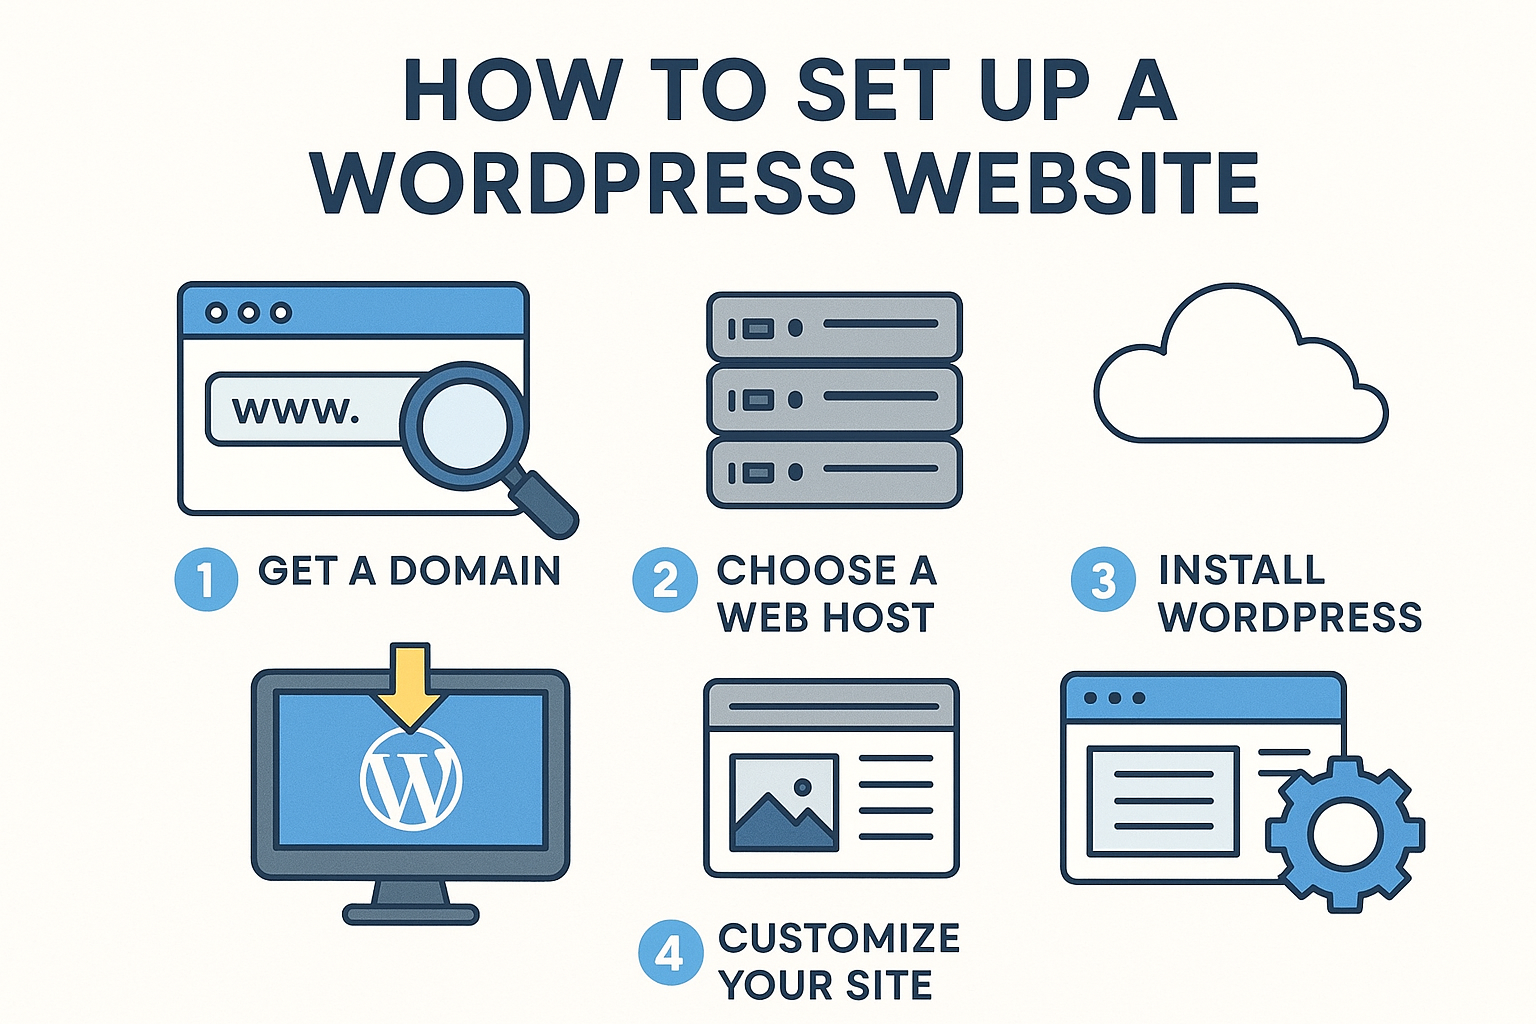
Step 1: Get Your Data Ready
Before you begin, gather all your data. This could come from:
Make sure your data is clean and well-organized. Example: sales data with columns like Date, Product, Quantity, Price, and Region.
Step 2: Import Your Data into Power BI
Step 3: Transform and Clean Your Data
Use Power Query Editor to:
Clean data helps your visuals look neat and accurate.
Step 4: Create Visuals
Now the fun begins!
Drag your fields (like Sales, Product, Region) into the report view. Choose visuals like:
You can mix different visuals on one dashboard for a full business overview.
Step 5: Add Filters and Slicers
Make your report interactive by adding slicers.
Example: allow viewers to filter sales by year, product type, or location — all with a single click.
Step 6: Publish and Share
Once your report is ready:
Let’s say Goglow Hub wants to track training performance:
Within minutes, you can see which courses are most profitable and which months bring more enrollments.
✅ Keep your dashboard simple — avoid clutter.
✅ Use consistent colors and labels.
✅ Tell a story with your visuals — let viewers understand your key message at a glance.
✅ Regularly update your data to keep reports fresh.
Power BI is not just a reporting tool — it’s a business growth partner.
From tracking sales to monitoring training performance or analyzing customer feedback, Power BI helps you make data-driven decisions that move your business forward.
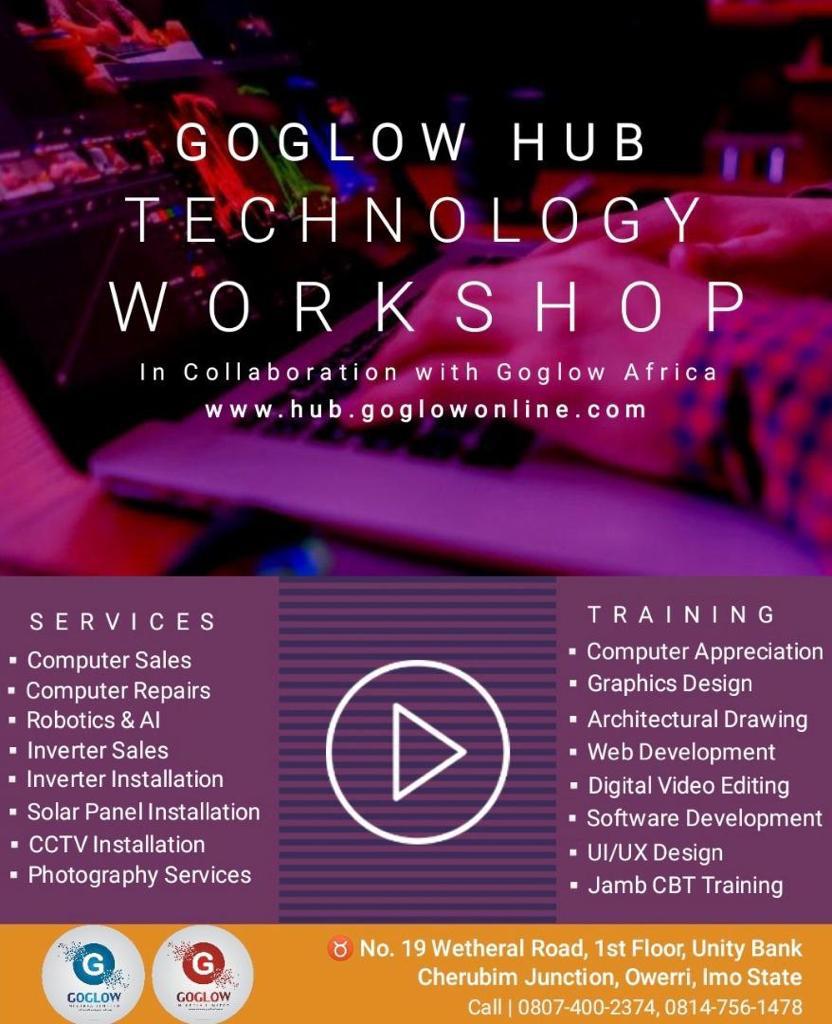
At Goglow Hub, we train individuals and businesses to use tools like Power BI to improve performance and achieve success.
If you’d like to learn Power BI practically, join our next training session at Goglow Hub, Owerri — and start turning your data into powerful business insights.


![]() Courses
Courses
 Graphics Design
 Web Development
 Mobile App Development
 System Application Development
 Computer Appreciation
 Architectural Design
 UI/UX Design
 Programming
 Software Development
 Computer Repairs
 Solar Panel Installation
 CCTV Installation
 Digital Photograpghy
 Digital Marketing
 Data Analytics
 Database Management
 Ethical Hacking
 Blockchain Development
 Jamb CBT Practice
 TOEFL Training
 IELTS Training